Quantification of LLD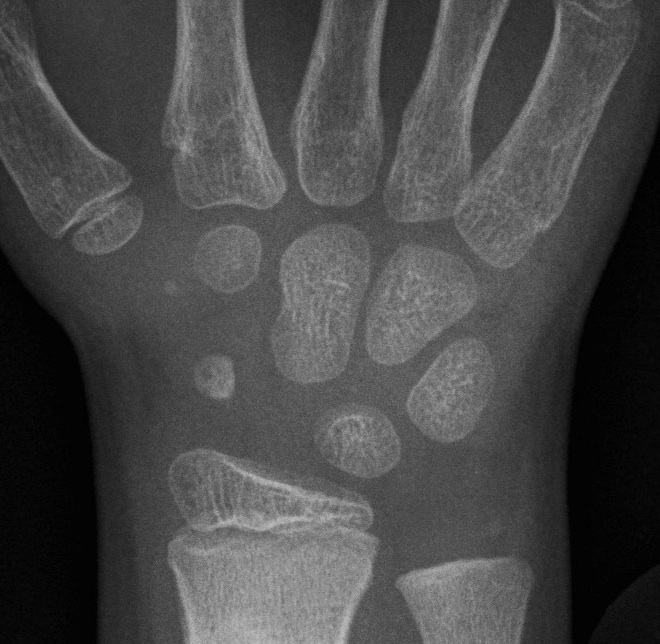
X-ray
1. Teleroentgenogram
- single exposure both legs
- long film with ruler
- Parallax errors
2. Orthoroentgengram
- same long Xray
- separate exposures hip, knee & AJ
- eliminates parallax error
- problem artefact
3. Scanogram
- similar separate exposures
- film moved between exposures
- smaller film
- multiple exposures
CT scan
Software measures distances
- accurate to 0.2 mm
- legs must be in same position
- fast
Skeletal Age
1. Greulich- Pyle Atlas
Xray Left hand (non dominant)
- correlated with Green- Anderson table LL
- less accurate < 6
- improved accuracy by focusing on hand bones rather than carpal bones
2. Tanner- Whitehouse Atlas
- more refined
- 20 landmarks graded L Hand
- more accurate
- can't use as not correlated with LL
Prediction of Growth
Note that all methods have an inherent error of 12 months
- gives accuracy to 1.5 cm
Need > 3 measures 4/12 apart for all methods
- If inadequate data wait till older or wait till skeletally mature
- If acquired event caused LLD, can plot onto graph
1. Menelaus "Rule-of-thumb" Method
Less accurate
- based on chronological age
- only valid from age ten
- convenient / easy / simple
Basic rules
- girls stop growing at 14
- boys stop growing at 16
- distal femur 9 mm
- proximal tibia 6 mm
- distal tibia / proximal femur 3 mm
Calculate how much growth lost from fusion of physis / Predict effect of epiphysiodesis
- Effect = Physis rate x years of growth Left
2. Green & Anderson tables
Growth remaining method
- uses skeletal age
- requires graph
- estimates growth potential in distal femur and proximal tibia at various skeletal ages
- separate charts for girls and boys
3. Moseley
Straight - Line Graph Method
- uses Green & Anderson data
- applied to a chart
At least 3 measurements each time
1. Length long leg
2. Length short leg
3. Skeletal age
Do so 3 times separated by 3-6 months
- accuracy improves with increased plotting
Plot the points for long and short leg on a vertical line for chronological age of either boy or girl
- create 2 lines for short and long leg over time
- line of best fit
- gives LLD at maturity at right of graph
Technique
- plot Long leg length on long leg line against skeletal age
- plot Short leg length on short leg line against skeletal age
- able with at least 3 measures to create line of best fit
- extend lines to maturity
- difference is LLD
Growth rate of each leg = slopes
- parallel or divergent
- AKA static or progressive
Then use Menelaus rule of thumb to determine appropriate age for epiphysiodesis
4. Paley multiplier
State of the art
- 2000
- take LLD for boy or girl
- multiplier for chronological or skeletal age
- predicts LLD at maturity
Patterns of LLD
Adds to difficulty
- static
- progressive
- regressive
Shapiro
1982 5 developmental patterns
- 75% types I and II
I Increasing
- LLD increases at constant rate
- hemihypertrophy / atrophy
- tibial pseudoarthrosis
II Increasing plateau
- similar early, but annual rate of increase diminishes thereafter
- Perthes
III Plateau
- discrepancy increases, then stabilises
- fracture femur
- DDH
- Polio
IV Increasing- decreasing
- similar to III, then late increase at end of growth
- DDH
- hemihypertrophy
V Decreasing
- Initial increase, steady, then decrease
Progressive LLD
Progression Rate = Change LLD / Time
Final LLD
- add Current LLD to Prog Rate x Time to Skeletal maturity